Gold Price Chart
Metal Price Alerts
Success
The price alert has been setup. You will be notified as soon as the price reaches the level you selected.
Live Gold Price Chart
Track the latest gold price today on our interactive gold chart. Our gold price chart shows the spot price of gold in ounces over various timeframes and in 3 major currencies.
Physical Gold’s live gold prices update every 30 seconds to provide you with the latest pricing information.
Use this chart if you want to know today’s gold price or analyse the price performance of gold over different time periods and across GBP, US Dollars and Euros. While past performance doesn’t guarantee future prices, it can help you predict future gold price trends and inform your buying and selling decisions.
If you’re considering selling or buying gold, why not use our price notification function. If you wish to be notified when the price falls to a certain level for a purchase, set that price alert at your desired level and receive an email into your inbox within a minute of the price hitting your target.
Conversely if you’re looking to maximise your selling price for gold you already own, why not set an alert at your target selling level. That way, you won’t miss out on top prices in a volatile market.
Factors Influencing the Gold Price
Gold prices are one of the most complicated commodities, unlike other assets, the price is relative to more than just a typical production, demand and inventory algorithm.
Even amateur investors can understand the correlation between traditional stock market data and the consequential shift in trading prices; however, because gold is effectively money, its price is also subject to additional influencers, namely:
- Global inflation, particularly that of the U.S., which indicates a rising supply of money;
- The ‘indirect pricing’ of production costs for other commodities;
- Activities of central banks including printing money and their trading of gold.
- Real interest rates (interest rates compared to wages and inflation), particularly those in the U.S.
- Trade and growth imbalances.
More Detail
- Interest Rates: Gold doesn’t pay interest or dividends, so when interest rates are high, investors may prefer to move their money into interest-bearing assets, causing the demand for gold to fall and thus its price to decrease. Conversely, when interest rates are low, gold becomes more attractive relative to interest-bearing assets, and its price can rise.
- Monetary Policy: Central banks around the world hold gold as part of their reserves. Changes in monetary policy can influence the price of gold. For example, when central banks increase their gold reserves, this can push up the price of gold. Quantitative easing, a monetary policy where a central bank buys government bonds to inject money into the economy, can also increase the price of gold by leading to inflationary pressures.
- Geopolitics: Gold is often viewed as a “safe haven” asset that retains its value during times of political instability or uncertainty. Therefore, geopolitical events that increase uncertainty can increase demand for gold and push up its price.
- Risk Aversion/Appetite: Related to the point above, during periods of financial market stress or volatility, investors often flock to gold as a safe haven, which can increase its price. Conversely, when financial markets are doing well and investor confidence is high, demand for gold can decrease, putting downward pressure on its price.
- Currency Markets: Gold is priced in U.S. dollars, so changes in the value of the dollar can influence the price of gold. When the dollar is strong, gold becomes more expensive for buyers using other currencies, which can decrease demand and lower the price of gold. Conversely, when the dollar is weak, gold becomes cheaper for buyers using other currencies, which can increase demand and push up the price of gold.
- Inflation or Deflation: As mentioned earlier, gold is often seen as a hedge against inflation. When inflation is high or expected to rise, demand for gold can increase, pushing up its price. In contrast, during periods of deflation (when prices are falling), the price of gold may also fall.
- Jewellery Demand: Gold has significant industrial use, particularly in the jewellery sector. Changes in the demand for gold jewellery, particularly in large markets like India and China, can influence the price of gold.
- Equity Markets: The performance of the stock market can influence the price of gold. When stock markets are doing well, investors may prefer to invest in stocks rather than gold, pushing down the price of gold. Conversely, when stock markets are doing poorly, investors may move their money into gold, pushing up its price.
In addition, influencing factors can be a combination of psychology, speculation and, to an extent, market manipulation.
The costs of extracting what gold is known to be left in the earth’s crust is an expensive business as much of this precious metal is alloyed with other metals making it harder (and more costly) to extract pure gold.
As a result, the production of gold is incredibly responsive to market prices; if the gold price per ounce is too low then production slows or ceases. In turn, this means less gold on the market which causes the price to rise.
Price of Gold in UK
The rising price of gold has been headline news in the UK for over a decade as the seemingly inexorable rise continues.
The price of gold in the UK hit an all-time high of more than £1,635 per ounce during April 2023.
This follows several years of gold thriving as a safe haven asset during a Covid affected global economy, followed by the high inflation and rising interest rate environment since.
The gold price is always derived in US Dollars first and then converted to other currencies. This means that the two factors directly impacting the UK Sterling gold price are the gold price in Dollars and the exchange rate of these two currencies.
If the value of Sterling falls against the Dollar, the Gold price in the UK rises in relative terms and vice versa.
Historically, the price has always been subject to some volatility but with a greater understanding of this valuable commodity, investors can use market knowledge to their advantage.
Knowing when to buy gold, when to hold on to gold and when to sell gold is crucial to turning a profit but just what influences the gold price.
Gold Price Per Gram
Often the price of gold is quoted in ounces, so to work out the price per gram you’ll need to do some simple calculation.
It’s best to be precise, so to the most decimal places one troy ounce of gold is the equivalent to 31.1035 grams. So whatever the current gold price per ounce, divide it by 31.1035 and you will have the gold price for one gram.
Gold Price Per Kilo
Similar to working out the price per gram, you’ll have to do some simple calculation to get an exact figure for the gold price per kilo.
There are 0.0311035 kilos in a troy ounce, so to work out the live gold price per kilo you need to divide the current live gold price per troy ounce by 0.0311035.
Where Do Live Gold Prices Come From?
Much like the stock markets, the price of gold is always in flux.
It is set using the prices of exchange traded futures found on the COMEX exchange, and then fixed for UK investors twice per day by the LBMA.
The exchange data is sent out to gold markets all over the globe to provide a live gold price. In short, it is determined using the most actively traded gold futures contract, which is commonly known as the most liquid, or benchmark contract.
This benchmark helps establish a universal currency-based reference point for all buyers and sellers.

The LBMA’s Role
The LBMA (London Bullion Market Association) is a non-profit trade organization representing the London market for gold and silver bullion.
The London base for the association stems from the history of the gold supply from the various global gold rushes being refined close to the Bank of England.
The Bank of England launched an approved list of producers who met the required standards in 1750, known as the London Good Delivery List, which still exists today.
The LBMA is responsible for creating a code of practice for LBMA members, focussed on production and trading of gold and silver. It is best known for its role in setting the global benchmark prices for the two main precious metals.
These prices are known as the LBMA Gold Price and LBMA Silver Price and are set twice daily Monday – Friday through a transparent and auditable process.
The LBMA also provides a range of services and resources, including publishing data on the amount of gold and silver in London vaults and market research.
The most significant change recently has been with the publishing of the two daily price fixes for both gold and silver. Historically the am and pm fix have been published minutes after the official fix.
However, accusations of price manipulation by the big players who help set the price has led to changes in 2018.
The LBMA now delays the publication of the daily fixes until the following working day to minimise any possible advantage of ‘fixing’ in a hope to eradicate any foul play.
The Daily Gold Price Fix
While the gold spot price fluctuates by the minute, the London Bullion Market Association (LBMA), provides two price fixes per day (10.30am GMT and 3 pm GMT) as reference points for the market.
The daily gold fix refers to the process and publication of setting the benchmark gold price twice a day during the working week in London. It’s also commonly referred to as ‘The London Fix’ and ‘The LBMA Gold Price’.
The process involves a group of approved representatives from fifteen bullion companies who meet twice a day to set the gold price.
The price is then administered independently by ICE Benchmark Association to ensure IOSCO Principles for Financial Benchmarks are met.
These price settings are done at 10.30am and 3.00pm Monday to Friday. In an attempt to reflect the practical price where gold trades, each member states the current price at which they would be willing to buy or sell gold through an auction platform.
These prices vary according to current levels of supply and demand.
The LBMA fix is used globally as a benchmark to price both electronic and physical gold transactions. The official price settings are published the following day on the LBMA website which also acts as a useful source of historical price information.
A Market History
Over the last five years, gold prices (whether this is in gold coins or gold bars) have risen from around £950 (February 2018) per ounce to around £1,550 (February 2023); that’s an increase of more than 60%.
This meteoric rise is commonly classed as a gold bull run, but there have been many times in gold’s long history where the price stagnates or declines.
Timing these bull and bear markets perfectly is impossible as so many factors influence the price and performance of gold, especially in a rapidly evolving global economy.
Investing in gold, for many people, is not about turning immediate profits and constantly analysing the gold price to liquidate their assets.
Gold is seen as a way of diversifying a portfolio to mitigate the risk of the kind of market exposure offered only by paper assets.
For many, this kind of investment decision is about shoring up a pension or other future financial retirement annuity. Historic prices, like other commodities, have followed wider economic trends as well as geopolitical changes.
Most significantly, as a form of money, gold is strongly linked to the currency markets, notably the US Dollar. A weak US Dollar is often a precursor to a higher price whilst a strong US Dollar can indicate a fall in gold prices.
Investors into physical gold bars and coins especially are advised to consider the investment as medium to long term, rather than trying to get rich quick.
Over extended periods of time, gold has outperformed inflation (therefore acting as a store of value) and many mainstream asset classes.
As of February 2023, approximate price rises over the long term have been;
- 5 year +63%
- 10 year + 47%
- 15 year + 233%
- 20 year + 605%
- 25 year + 760%
The 7 Crucial Considerations Before You Buy Gold & Silver
Insider tips to help profit from gold investment
Currency influence (UK vs the US)
Due to its historical link to the US Dollar, the gold price is still to this day initially quoted in USD. This is fine as a benchmark to determine how the underlying price is faring.
However, when purchasing and selling gold outside of the US, currency exchange rates come into play. For UK investors, it’s actually the price in Sterling terms that is important.
This is where it gets complicated!
Despite what many people say, Britain still plays a significant role on the international stage. Its economy is still the 5th largest globally with its Gross Domestic Product (GDP) topping $3billion.
In fact, it pushed France down a position as recently as 2014. Britain also has a very established international trade network so any rise or fall in our stock markets or currency will likely impact overseas investors.
So, it makes sense that the price could go up if there’s either very poor economic data out of the UK which could impact the world stage, or political instability or international disputes affecting the UK.
After all, gold is a hedge against traditional fiat currencies, so it should rise when a major fiat currency falls.
However, with Britain increasingly shrinking when compared with the growth of the emerging economies such as China and India, negative news in the UK tends to have a limited impact on the $ gold price.
Only when the news is more international, perhaps the UK joining the US in airstrikes in the Middle East, will the underlying price benefit.
So, Sterling can be ignored? Not at all. As a UK buyer or seller of gold, Sterling plays a huge role, but indirectly.
As the Pound weakens against the Dollar, the gold price increases in the UK. That’s simply the effect of the gold price being converted at a higher rate (weaker Pound) from Dollars into Sterling.
So, the general rule of thumb is, the price of gold in the UK goes up when the Pound weakens (against the Dollar) and it declines when the Sterling strengthens against the Dollar.
The problem arises when bad news in the US can weaken the Dollar, pushing gold up in $ terms, but at the same time, the Dollar falls against Sterling, pulling the gold price UK back down. It’s impossible to know which factor will push or pull the hardest!

Pricing gold coins and bars
If you want to know the price of gold coins or bars, then a few other factors have to be considered.
Here are the factors you need to consider:
- Firstly, start by determining the spot price for gold in the currency you wish to transact. So, as a simple example, the UK price may be £1,500 per ounce or £48.22 per gram. This isn’t the price at which you can buy or sell physical gold but instead acts as a benchmark to calculate the price of gold coins and bars.
- Next, you need to convert it to the size of your coin or bar. So, for a 100g gold bar, the quickest method is to multiply £48.22 per gram by 100=£4,822.00. Or for a Sovereign coin, you can multiply £48.22 per gram by 7.32 (as this is its pure gold weight in grams)=£352.97.
- However, this is their spot rate equivalent. When buying coins or bars, there’s then a premium to add. The size of this premium will include the production and distribution cost, the dealer’s fee, the number of items you’re purchasing and finally any historical value.
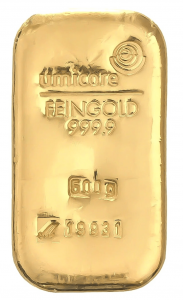
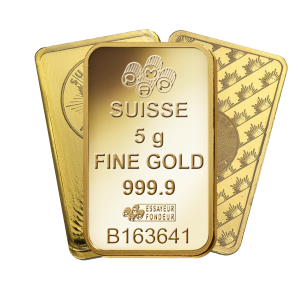
Generally, production cost will be smaller as a percentage, the bigger the piece of gold, and vice versa. In other words, it’s far less significant on a 1kg gold bar worth £50k than a 5g gold bar worth £290.
Dealers also incentivise the buyer to purchase larger quantities by reducing their margin with the more that are bought. So, it’s worth trying to buy as much gold at once as possible to reduce this charge.
You’ll need to do the maths on whether it’s better value to buy gold bars as 1 x 1 kg or 10 x 100g. Usually, 1x1kg will be slightly cheaper but offers no flexibility for partial sales.
Finally, the age of the coins may well push up their price as they command a higher premium due to scarcity, desirability and collectability.
For instance, a brand new Sovereign coin may well cost £400, while the value of a Victorian gold Sovereign could be as high as £450! It’s the same amount of gold, just worth different amounts (up to 30%).
Old gold bars do not command a similar premium as there’s little to distinguish old bars from new.
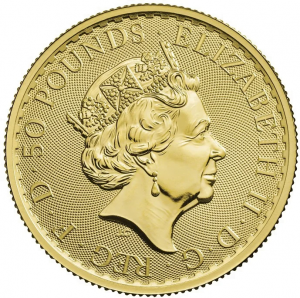
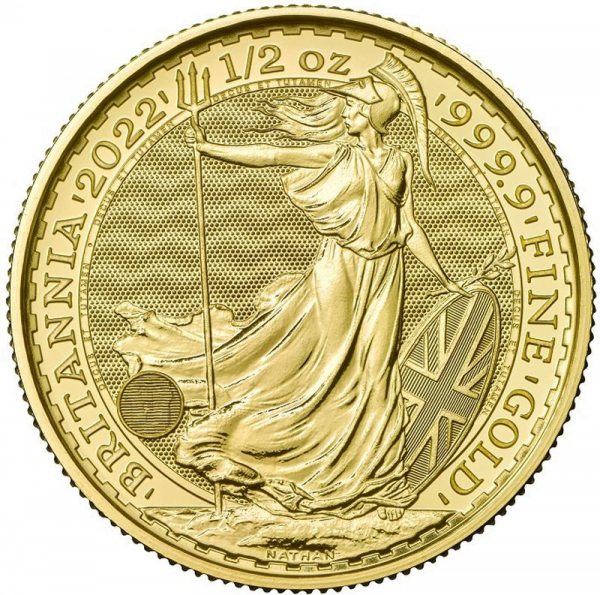
The gold finish will also impact the price of gold coins (such as gold Britannias). Bullion finish is the cheapest finish for coins and appeals to those looking for investment value.
A proof finish coin is struck up to 3 times and takes longer to produce. We describe the difference in look as comparing standard definition TV to Ultra high definition.
The Proof coins have a matt portrait and shiny background, making the whole image look more 3 dimensional.
This is fine for collectors, but the difference can be as high as 30%, especially as many proof coins come in presentation boxes and in limited issue.
Most mainstream UK coins are produced to both finishes, so we’d recommend sticking with bullion versions to keep the gold price down, especially as dealers won’t pay you the same premium when you sell proof coins.
Live Gold Coin and Gold Bar Prices
Gold Britannia Coins
View products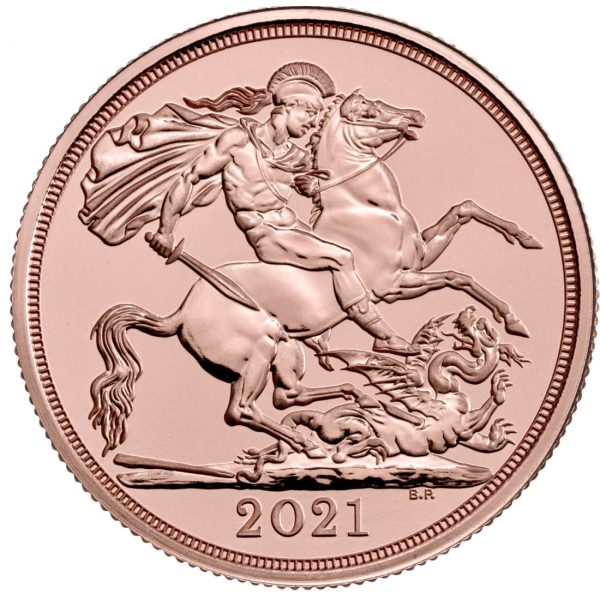
Gold Sovereign Coins
View products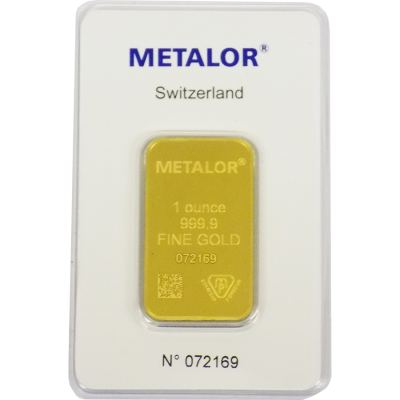
1oz Gold Bars
View products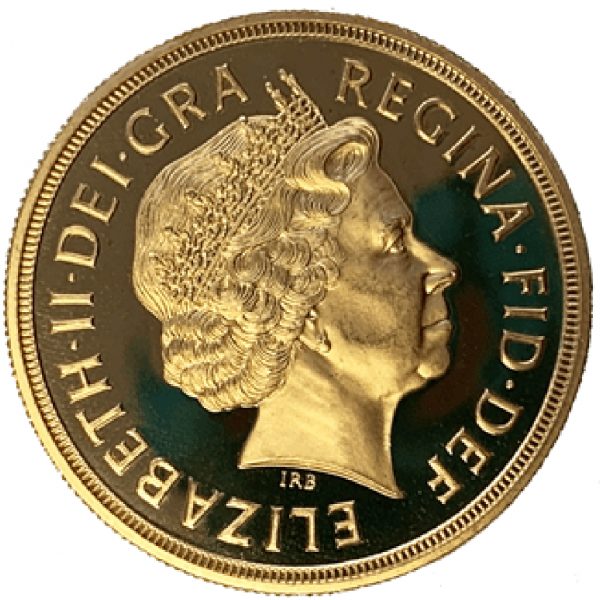
Best Value Gold Coins
View productsWhy is Gold More Expensive than Silver?
Quite simply, gold is a much rarer metal than silver though silver is becoming more widely acknowledged as a diminishing precious metal which is causing the price of silver to rise.
Silver investment is, therefore, being adopted by many investors due to the current low entry price point coupled with the potential rate of growth.
At a simple supply and demand level, gold is one of the rarest elements on our planet. It is estimated that if all of the gold ever mined was melted down and stored in one place, it would only fill one Olympic sized swimming pool.
The gold price per ounce reflects this scarcity in the same way that works by artists like Da Vinci and Picasso are valued; limited in supply but high in demand.
Currencies Which the Gold Price is Published In
The gold price is often quoted in US Dollars but is also priced in many currencies, which are summarised below:
- Principle global currency – US Dollars
- Australian Dollars
- British Pounds
- Canadian Dollars
- Euros
- Singapore Dollars
- South African Rand
- Swiss Francs
- China – Onshore and Offshore Yuan
- Indian Rupees
- Japanese Yen
- Malaysian Ringgit
- Russian Rubles
- New Taiwan Dollars
- Thai Baht
- Turkish Lira
You may also find useful

