


Gold Price Predictions for 2026
04/12/2025Daniel Fisher
Accumulate gold coins on a regular basis for home delivery or storage.
Let our experts hand-pick a gold investment portfolio for you.
Free & fully insured UK Delivery. Learn more

Secure & flexible payments. Learn more

Buyback Guarantee Learn more

A cost-effective way to buy silver bullion with off-shore storage
Let our experts hand-pick a silver investment portfolio for you.
Free & fully insured UK Delivery. Learn more
Secure & flexible payments. Learn more
Buyback Guarantee Learn more


Free & fully insured UK Delivery. Learn more
Secure & flexible payments. Learn more
Buyback Guarantee Learn more
Accumulate gold coins on a regular basis for home delivery or storage.
Let our experts hand-pick a gold investment portfolio for you.
A cost-effective way to buy silver bullion with off-shore storage
Let our experts hand-pick a silver investment portfolio for you.
Free & fully insured UK Delivery. Learn more
Secure & flexible payments. Learn more
Buyback Guarantee Learn more
Free & fully insured UK Delivery. Learn more
Secure & flexible payments. Learn more
Buyback Guarantee Learn more
Consensus Takeaway for 2026
Where are prices heading?
Gold has entered a new structural phase, shaped by persistent geopolitical tensions, long-term inflation risks, and a notable shift in global central-bank behaviour. After reaching repeated all-time highs in 2024 and 2025, investors now want to understand whether gold’s momentum can continue into 2026. Will the market carry on climbing, consolidate, or face a more challenging environment?
Predicting market prices is a minefield, especially in a world as unstable as the one in which we find ourselves entering 2026. This forecast draws together expert projections, macroeconomic influences, technical indicators, futures-market signals, and UK-specific factors – including the often-overlooked impact of the pound–dollar exchange rate on UK gold prices.
For readers who want background context on how gold is priced, you can learn more in our guide on who sets the gold price and how it is determined.
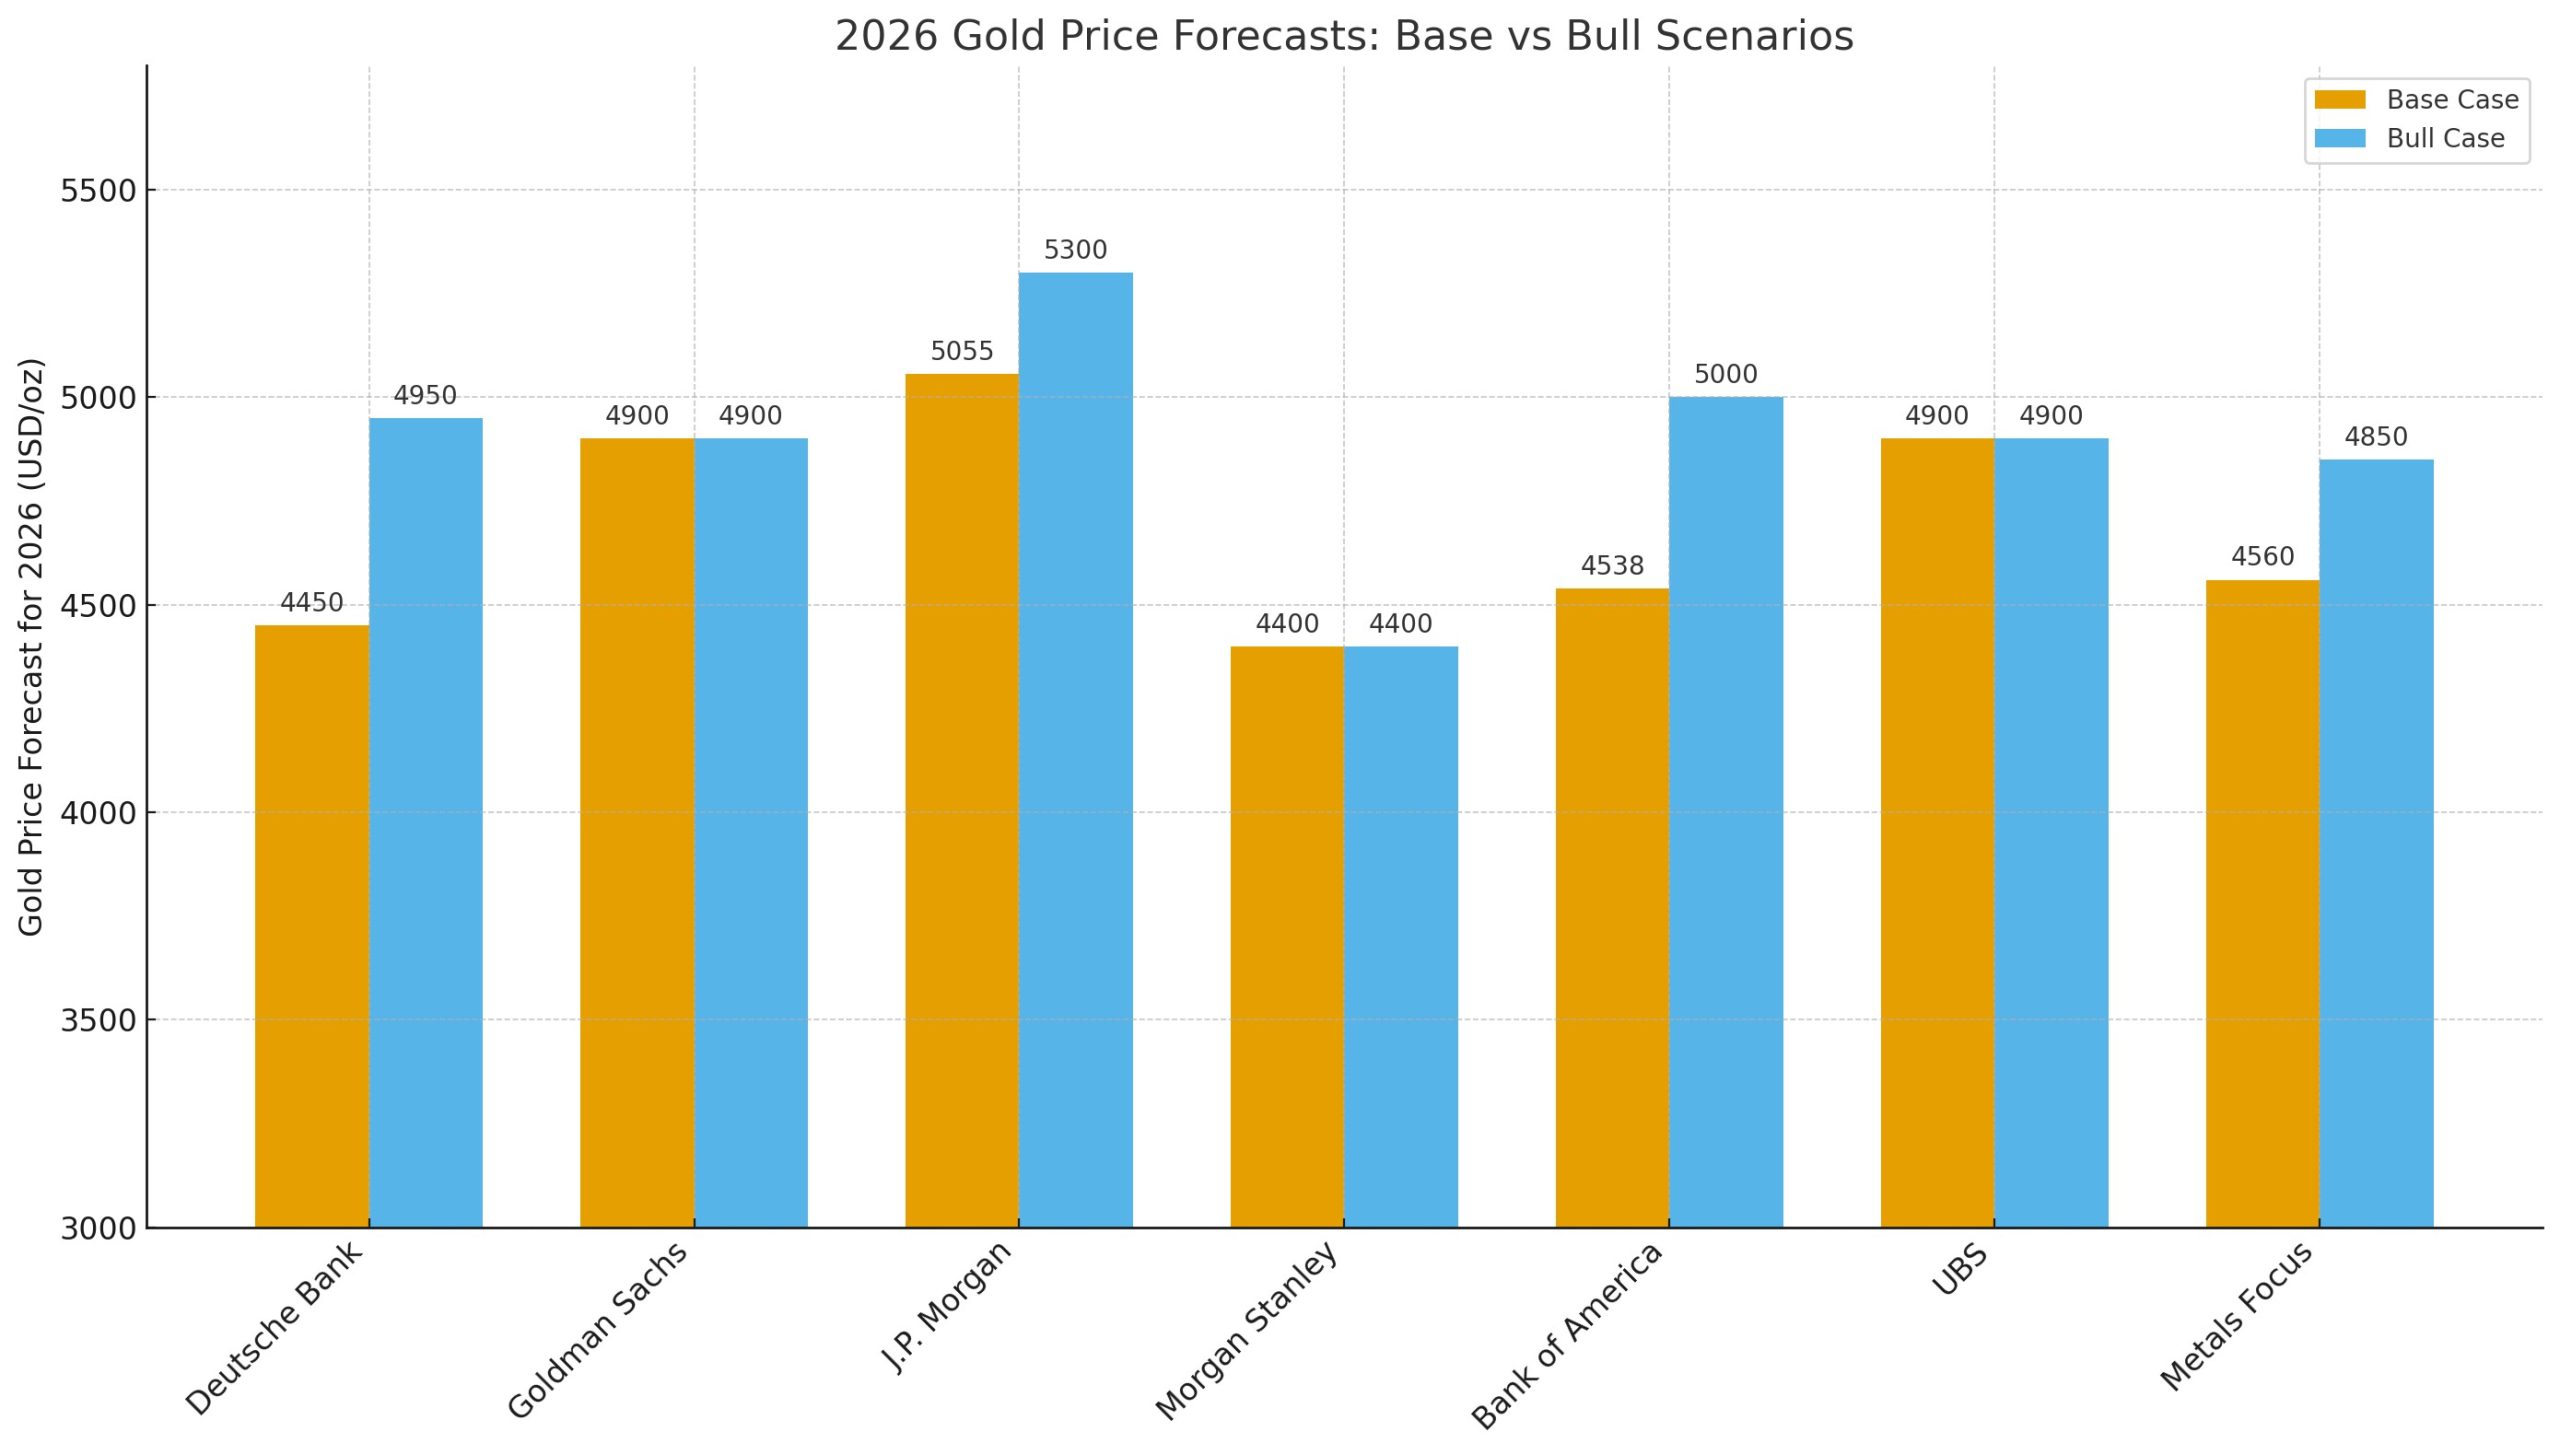
Top analyst base and bull case 2026 gold price predications
Below shows what the value of a £10k gold investment could be worth in 2026, if the gold price hits the various expert forecasts.
The 2026 outlook suggests that gold remains in a structurally supported market, rather than a speculative rally. With central-bank buying, persistent geopolitical uncertainty, and constrained physical supply forming a durable floor under prices, pullbacks may be shallower and shorter than in previous cycles.
For new buyers, this means two things. First, waiting for a significant correction may not be as effective as it was in years when gold was more sensitive to interest-rate cycles. Secondly, the pound–dollar exchange rate will play a major role in whether UK buyers face higher or more moderate prices. A stronger pound can create brief windows of opportunity, even if USD gold stays elevated.
Overall, the environment favours phased or strategic buying rather than attempting to time the absolute bottom.
For existing holders, the 2026 landscape is broadly constructive. Analysts highlight strong structural demand, ETF re-accumulation, and ongoing physical tightness as factors that could continue to lift prices. Many institutional forecasts place upper-range targets between $4,500 and $5,300/oz, with some modelling scenarios stretching higher if central-bank flows accelerate.
This suggests that gold could continue to act as an effective store of value during a period of elevated macro uncertainty. Long-term holders may find that the structural drivers make a compelling case for maintaining positions, particularly given the weakness of fiat currencies, shifts in global monetary policy, and the increased use of gold as a reserve diversification tool by emerging-market central banks.
If your investment objective is wealth preservation rather than short-term speculation, 2026 appears to support a continued hold stance. Our team are always happy to discuss your objectives and possible strategies for the year ahead 020 7060 9992.

If you are weighing up whether to sell gold, the decision hinges on whether your goals are tactical or long term. Prices have already risen significantly into 2025–26, so locking in gains may make sense for investors with short-term profit targets or cash-flow needs.
However, selling purely because gold has reached new highs may be premature given the outlook. Many of the forces lifting gold are structural rather than cyclical: a weaker dollar, sustained official-sector buying, long-term fiscal deterioration in the US, and persistent uncertainty in global markets. These are not conditions that resolve quickly.
If you decide to sell, doing so in stages rather than all at once may help you capture further upside should momentum continue. If you are selling to rotate into risk assets, consider the possibility that volatility remains elevated in 2026 and gold may continue to offer valuable hedging benefits.
Analyst expectations for 2026 have shifted decisively higher, with most major institutions now forecasting gold between $4,000 and $5,300 per ounce, and several modelling scenarios materially above that range.
These projections reflect differences in expectations for inflation, monetary policy, and supply–demand tightness. Readers looking for historical context can view long-term patterns in our Gold Price Charts resource.
Free ultimate guide for keen precious metals investor
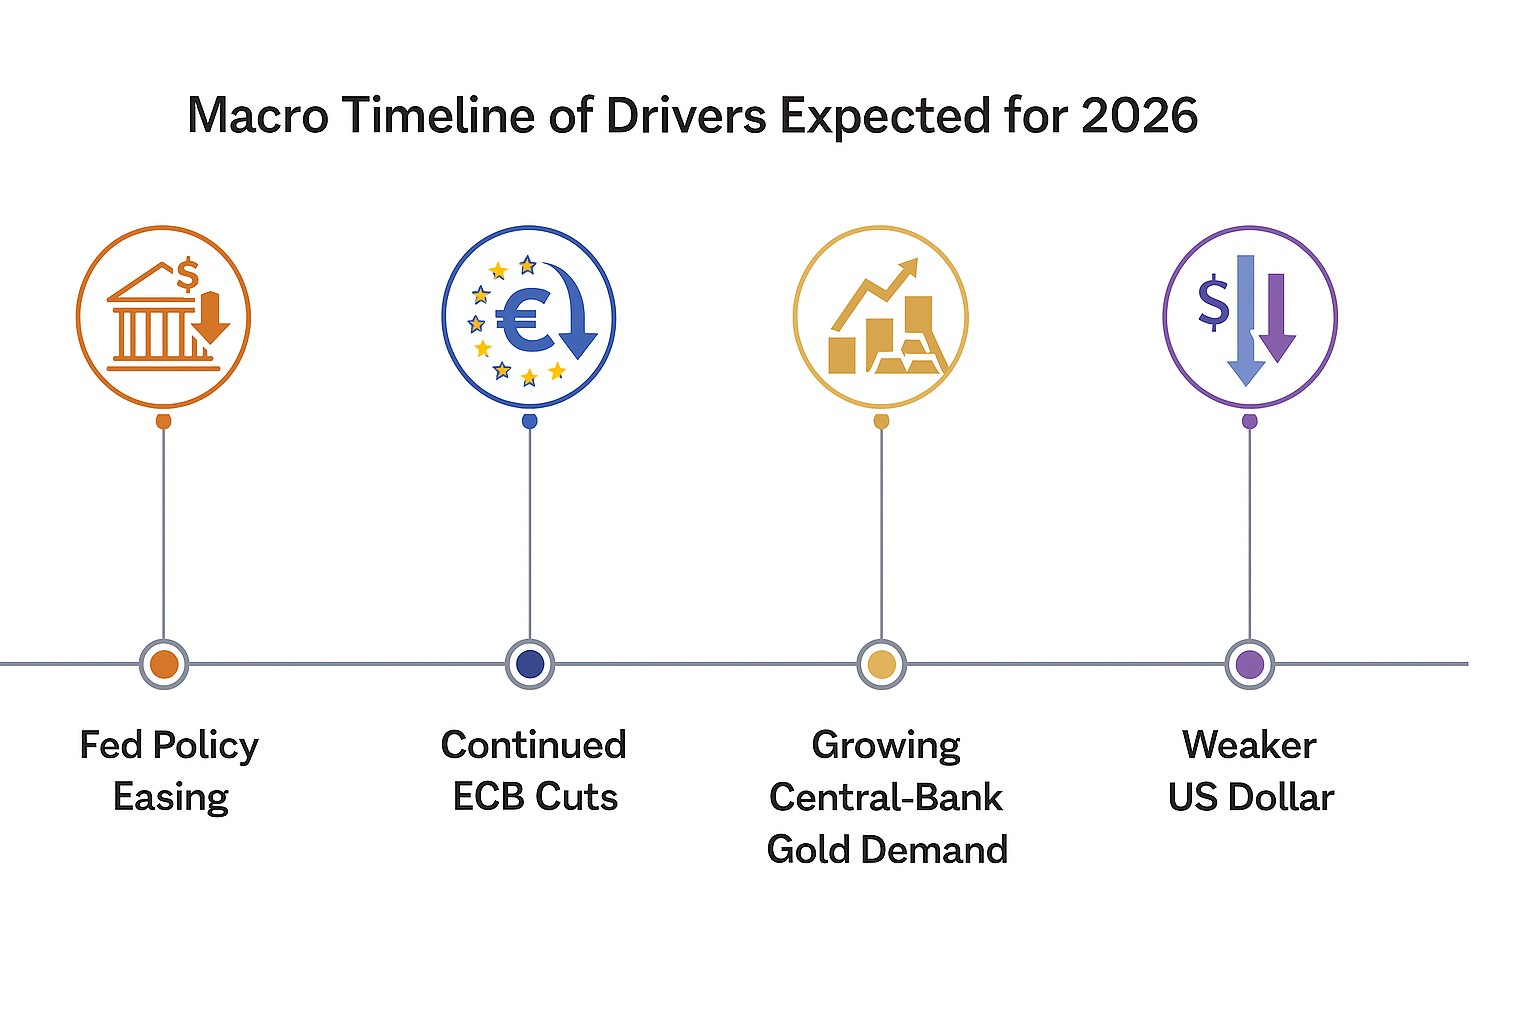
Gold’s outlook for 2026 is shaped by an unusually strong alignment of structural demand, macroeconomic uncertainty, currency weakness and physical-market tightness. Below is a detailed look at the key drivers- and how they are likely to influence the gold price during 2026. Readers seeking a broader understanding of what moves gold prices can read our in-depth analysis.
Central-bank accumulation has become the single most influential structural force in the gold market. Emerging-market central banks, in particular, are drastically increasing their allocations as part of a long-term diversification strategy.
Why this matters for 2026:
Impact on 2026:
➡️ Strongly bullish. Central-bank buying establishes a structural price floor. Deutsche Bank estimates $3,900/oz support in 2026.
ETF demand has been soft in recent years due to high real yields and attractive cash returns. However, as the Fed begins cutting rates, these conditions reverse.
Why this matters for 2026:
Impact on 2026:
➡️ Bullish. ETF flows are highly rate-sensitive and could amplify price gains if rate cuts arrive sooner or deeper than expected.

With each year that passes, gold becomes increasingly difficult to mine as we have to delve deeper to keep extracting supply. Read more about the challenges of gold mining. Long-term supply constraints continue to tighten the fundamental balance.
Why this matters for 2026:
Impact on 2026:
➡️ Bullish. Limited supply reinforces the structural upward trend and limits downside.
The global environment continues to be marked by policy unpredictability, geopolitical tensions and trade fragmentation.
Why this matters for 2026:
Impact on 2026:
➡️ Bullish to strongly bullish. Geopolitical uncertainty consistently increases gold allocations, particularly among reserve managers and institutional investors.
Rapidly expanding US deficits and long-term fiscal deterioration weaken the US dollar and strengthen gold.
Why this matters for 2026:
Impact on 2026:
➡️ Strongly bullish. Dollar deterioration is one of the strongest medium-term drivers and aligns with most institutional “bull case” targets.
Goldman Sachs separates buyers into “conviction buyers” (central banks, ETFs, speculators) and “opportunistic buyers” (households and Emerging Markets consumption markets).
Households in emerging markets such as India, China, Turkey, and Vietnam hold deep cultural connections to gold. Their deep long-standing association with gold enables them to comfortably buy when prices fall. India and China alone account for over half of the global jewellery demand.
Why this matters for 2026:
Impact on 2026:
➡️ Bullish. A market dominated by conviction buyers tends to experience stronger and more persistent price trends.
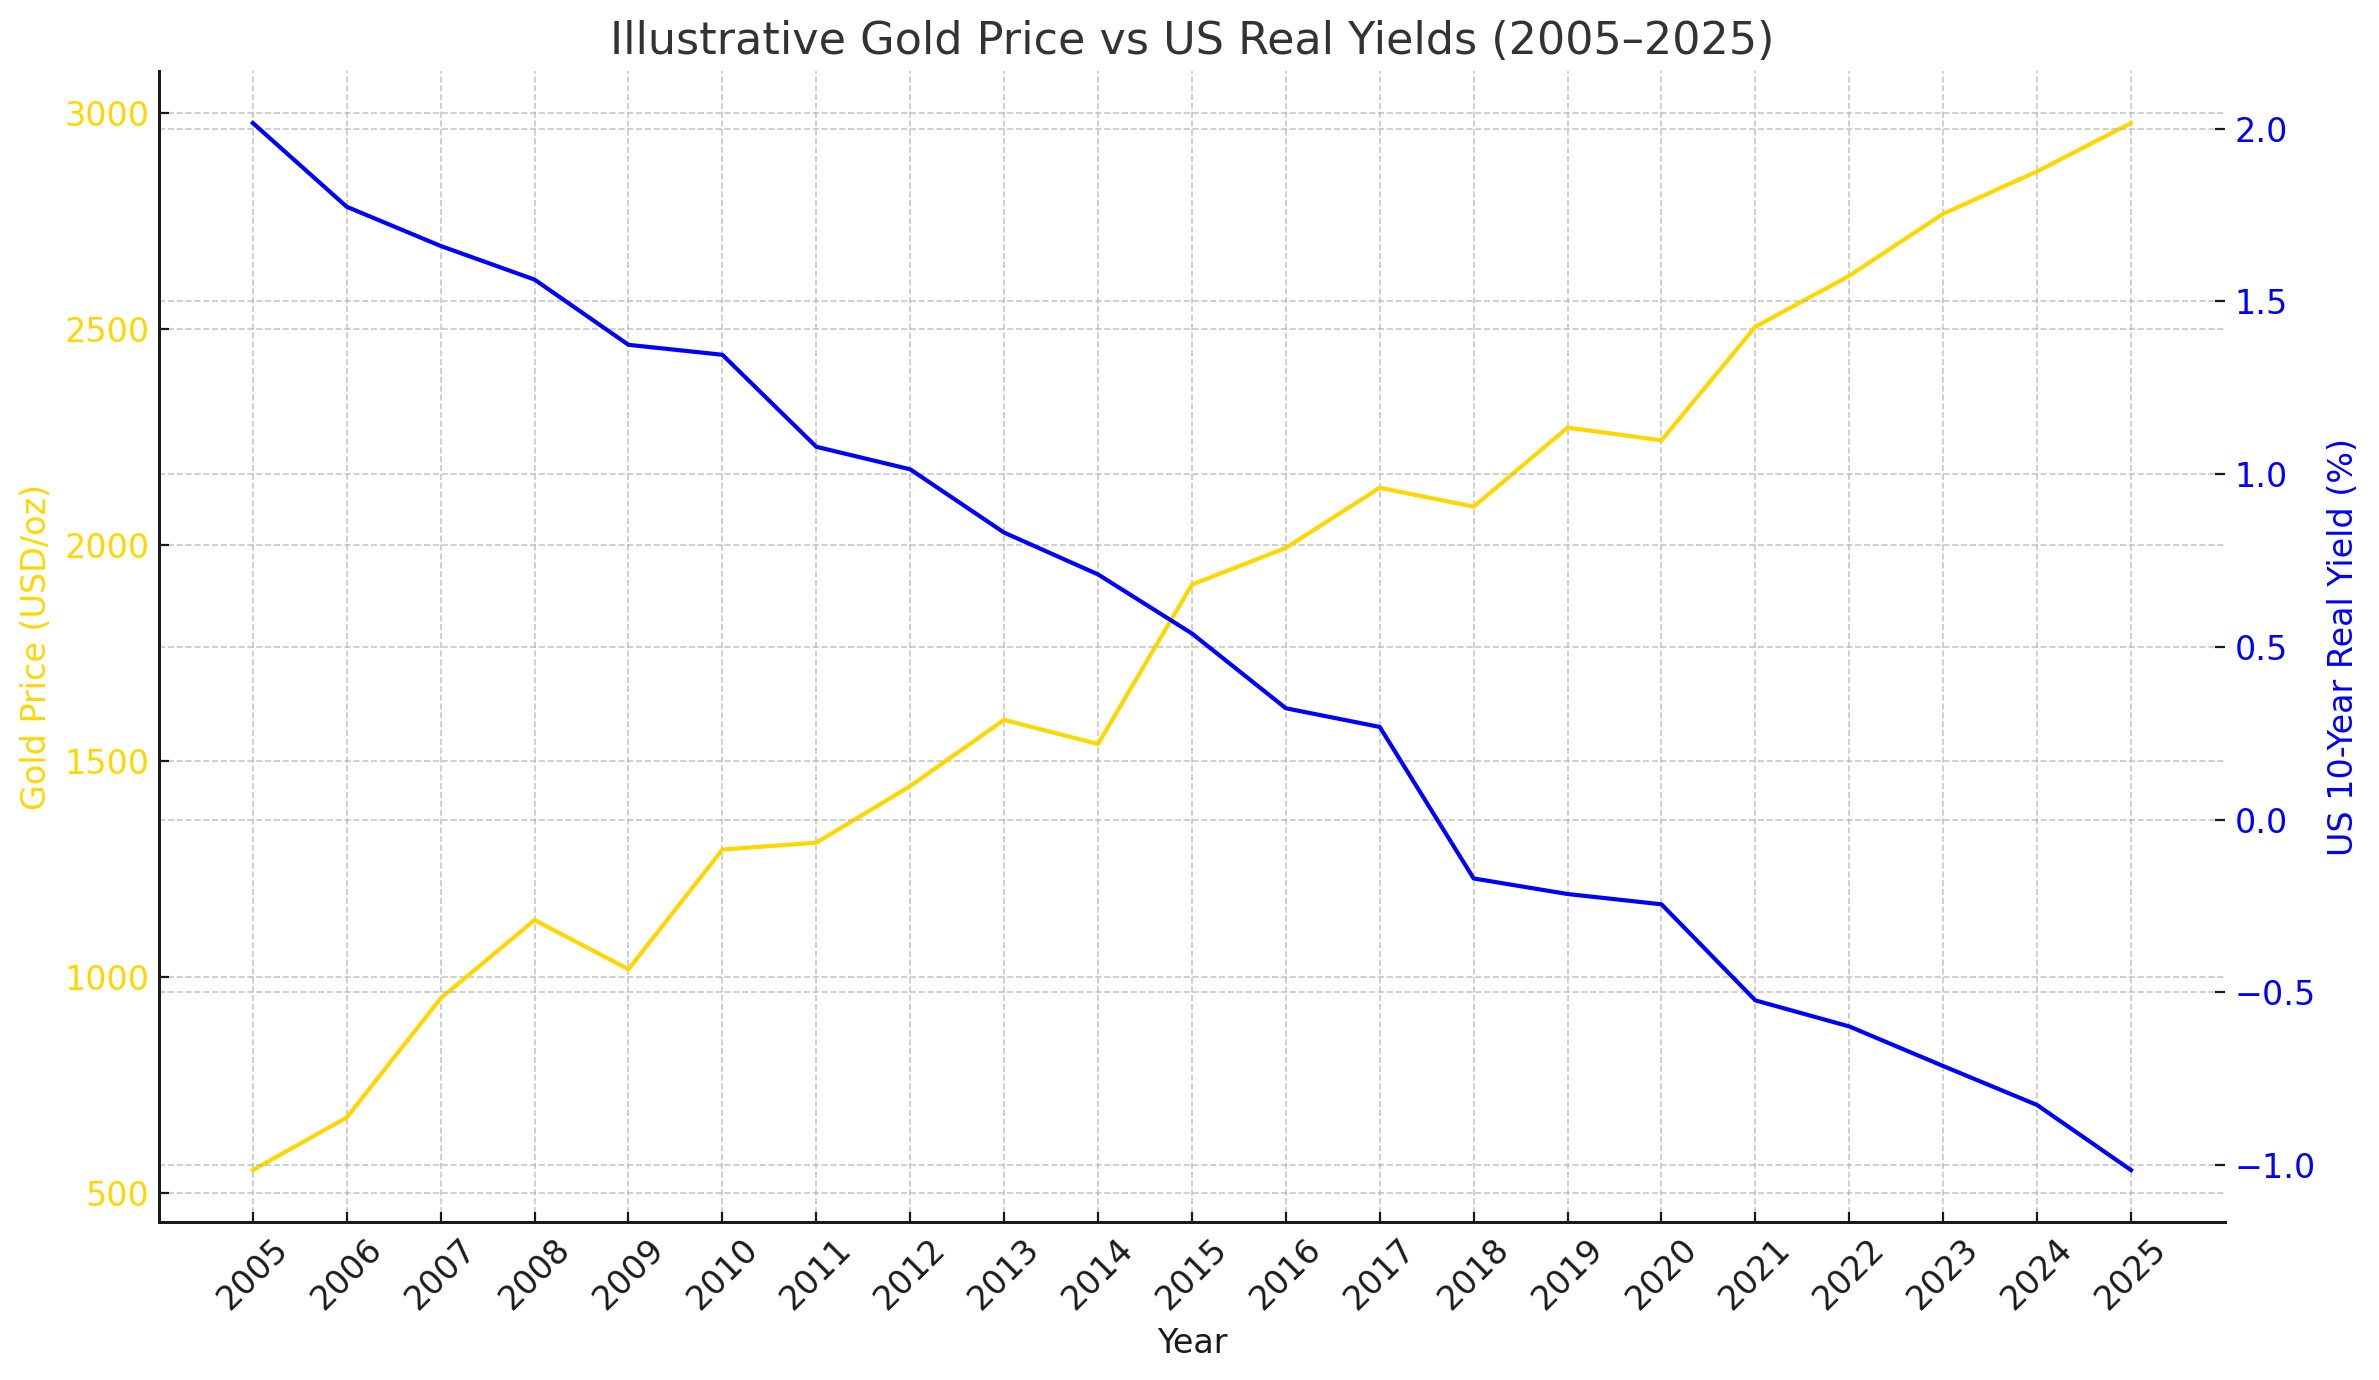
Real yields show how much you actually earn on a bond or interest-bearing asset after accounting for inflation. Read more on our research into the effect inflation has on the price of precious metals. Gold has no yield, so its relative attractiveness depends heavily on real yields:
This inverse relationship is one of the strongest long-term correlations in financial markets.
Why this matters for 2026:
For a deeper explanation of this dynamic, readers can explore the relationship between gold and interest rates.
Impact on 2026:
➡️ Moderately bullish, unless the Fed tightens unexpectedly.
While the outlook is predominantly bullish, several risks could moderate price appreciation.
Impact on 2026:
➡️ Risks are real but secondary. Most institutions consider them unlikely to derail the structural bull trend.
Overall impact for 2026
Almost all major factors point in the same direction:
→ Structural demand is rising
→ Supply is tight
→ Central banks are buying at record pace
→ ETFs are set to re-enter
→ Macro uncertainty and US fiscal weakness persist
This is an exceptionally rare alignment that supports the high-end analyst forecasts of $4,500–$5,300/oz, with aggressive scenarios extending toward $6,000/oz.
While gold is priced in US dollars, UK investors must consider the pound–dollar exchange rate, which heavily influences the price paid in pounds.
If the Bank of England cuts interest rates more quickly than the Federal Reserve, the pound may weaken, leading to higher UK gold prices. Conversely, stronger UK growth or slower cuts could push sterling higher and moderate gold’s rise in pounds.
Because gold is denominated in dollars, any movement in GBP/USD directly alters the GBP price:
For example, gold at $3,000/oz priced at GBP/USD 1.23 gives roughly £2,439 per ounce. If GBP/USD falls to 1.18, the same $3,000 becomes around £2,542.
Sterling recently found support around 1.30 and recovered to 1.3275, helped by a softer US dollar. Bank of America expects this rebound to continue, forecasting GBP/USD to rise towards 1.45 by the end of next year. Its view is based on a bearish outlook for the dollar, driven by expectations of a more dovish Federal Reserve under a new Chair and the risk that stubborn inflation could further weaken US real yields.
For the pound, Bank of America argues much of the selling linked to the UK budget has already happened, leaving room for short covering. While the Bank of England’s MPC is expected to cut rates, markets have largely priced this in, which may limit further downside in sterling.
If the pound strengthens as projected, it could moderate the rise in UK gold prices, since a higher GBP/USD rate makes dollar-denominated gold cheaper. However, if sterling weakens again or global risk sentiment shifts, UK gold prices could still climb even if USD gold is stable.
Understanding the importance of this relationship as well as just focusing on the underlying gold price can help decide on timing your gold trades. Our guide on when to buy gold covers how to navigate these currency-driven price changes.
Understanding the importance of this relationship as well as just focusing on the underlying gold price can help decide on timing your gold trades. Our guide on when to buy gold covers how to navigate these currency-driven price changes. Futures markets can reveal turning points before they appear in spot prices.
Since 2024, concentrated short positions on COMEX have declined sharply. High short concentration often restrains upward movement, so this reduction allows stronger price progression.
Managed money positions remain below historic peaks, meaning investor participation is far from saturated. Renewed ETF or futures inflows could provide a strong second wave of buying.
Gold typically trades in mild contango, but any movement into backwardation could signal supply tightness or strong near-term demand, both historically linked with rising prices.
For a clearer explanation of how futures markets work, see the gold futures market. Those interested in liquidity indicators can explore our article on GOFO, which explains how gold forward rates have historically signalled supply stress.
Most major banks expect gold to trade between $4,000 and $5,300 per ounce in 2026, with some models suggesting higher levels if central-bank buying and ETF inflows remain strong. J.P. Morgan forecasts $5,055/oz, Goldman Sachs predicts $4,900/oz, and Bank of America sees upside to $5,000/oz.
Yes. Analysts widely agree that gold is likely to rise further in 2026 due to sustained central-bank demand, falling real interest rates, strong ETF inflows and long-term diversification out of the US dollar. Tight physical supply also supports a continued uptrend.
Central banks are increasing gold reserves to diversify away from the US dollar, reduce currency risk and strengthen financial stability. Since 2022, emerging-market reserve managers have accelerated purchases, turning gold into a structural rather than cyclical component of reserve portfolios.
Interest rate cuts usually push gold prices higher. Lower rates reduce the opportunity cost of holding non-yielding assets, boosting demand from both institutional investors and gold-backed ETFs. Fed easing is a major reason banks expect further gains in 2026.
Gold is priced in US dollars, so changes in GBP/USD directly affect UK gold prices. A weaker pound makes gold more expensive for UK buyers, while a stronger pound lowers the local price even if global gold prices remain unchanged.

Share this post on:
Latest Posts:
Live Gold Spot Price in Sterling. Gold is one of the densest of all metals. It is a good conductor of heat and electricity. It is also soft and the most malleable and ductile of the elements; an ounce (31.1 grams; gold is weighed in troy ounces) can be beaten out to 187 square feet (about 17 square metres) in extremely thin sheets called gold leaf.
Live Silver Spot Price in Sterling. Silver (Ag), chemical element, a white lustrous metal valued for its decorative beauty and electrical conductivity. Silver is located in Group 11 (Ib) and Period 5 of the periodic table, between copper (Period 4) and gold (Period 6), and its physical and chemical properties are intermediate between those two metals.