


What’s Causing the 2025 Silver Supply Squeeze?
29/10/2025Daniel Fisher
Accumulate gold coins on a regular basis for home delivery or storage.
Let our experts hand-pick a gold investment portfolio for you.
Free & fully insured UK Delivery. Learn more

Secure & flexible payments. Learn more

Buyback Guarantee Learn more

A cost-effective way to buy silver bullion with off-shore storage
Let our experts hand-pick a silver investment portfolio for you.
Free & fully insured UK Delivery. Learn more
Secure & flexible payments. Learn more
Buyback Guarantee Learn more


Free & fully insured UK Delivery. Learn more
Secure & flexible payments. Learn more
Buyback Guarantee Learn more
Accumulate gold coins on a regular basis for home delivery or storage.
Let our experts hand-pick a gold investment portfolio for you.
A cost-effective way to buy silver bullion with off-shore storage
Let our experts hand-pick a silver investment portfolio for you.
Free & fully insured UK Delivery. Learn more
Secure & flexible payments. Learn more
Buyback Guarantee Learn more
Free & fully insured UK Delivery. Learn more
Secure & flexible payments. Learn more
Buyback Guarantee Learn more
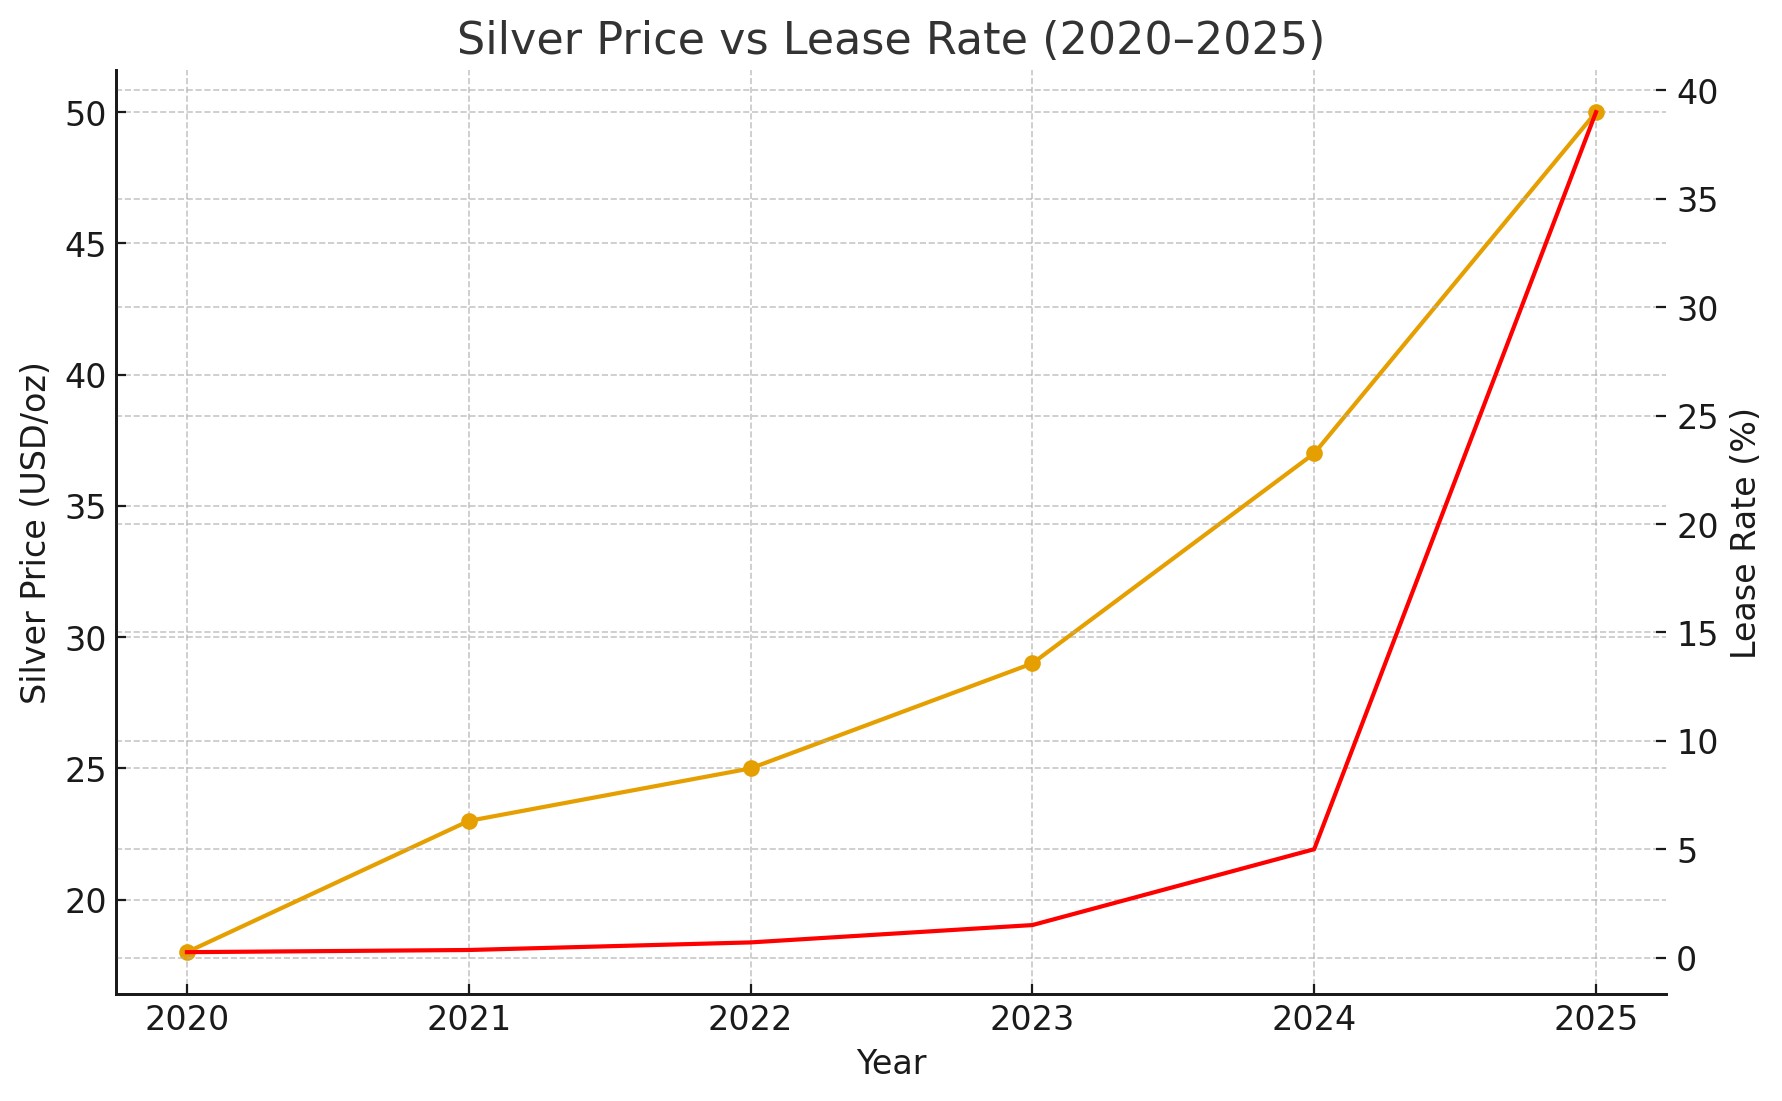
Silver has staged an extraordinary rally in 2025 – soaring more than 80% in dollar terms and reaching record highs above $50 (around £41) per ounce.
What began as a steady climb has become a full-scale supply crunch, with analysts now warning of a potential “silver squeeze”.
But what’s driving this tightening in physical supply, and how might it affect investors and industrial users alike?
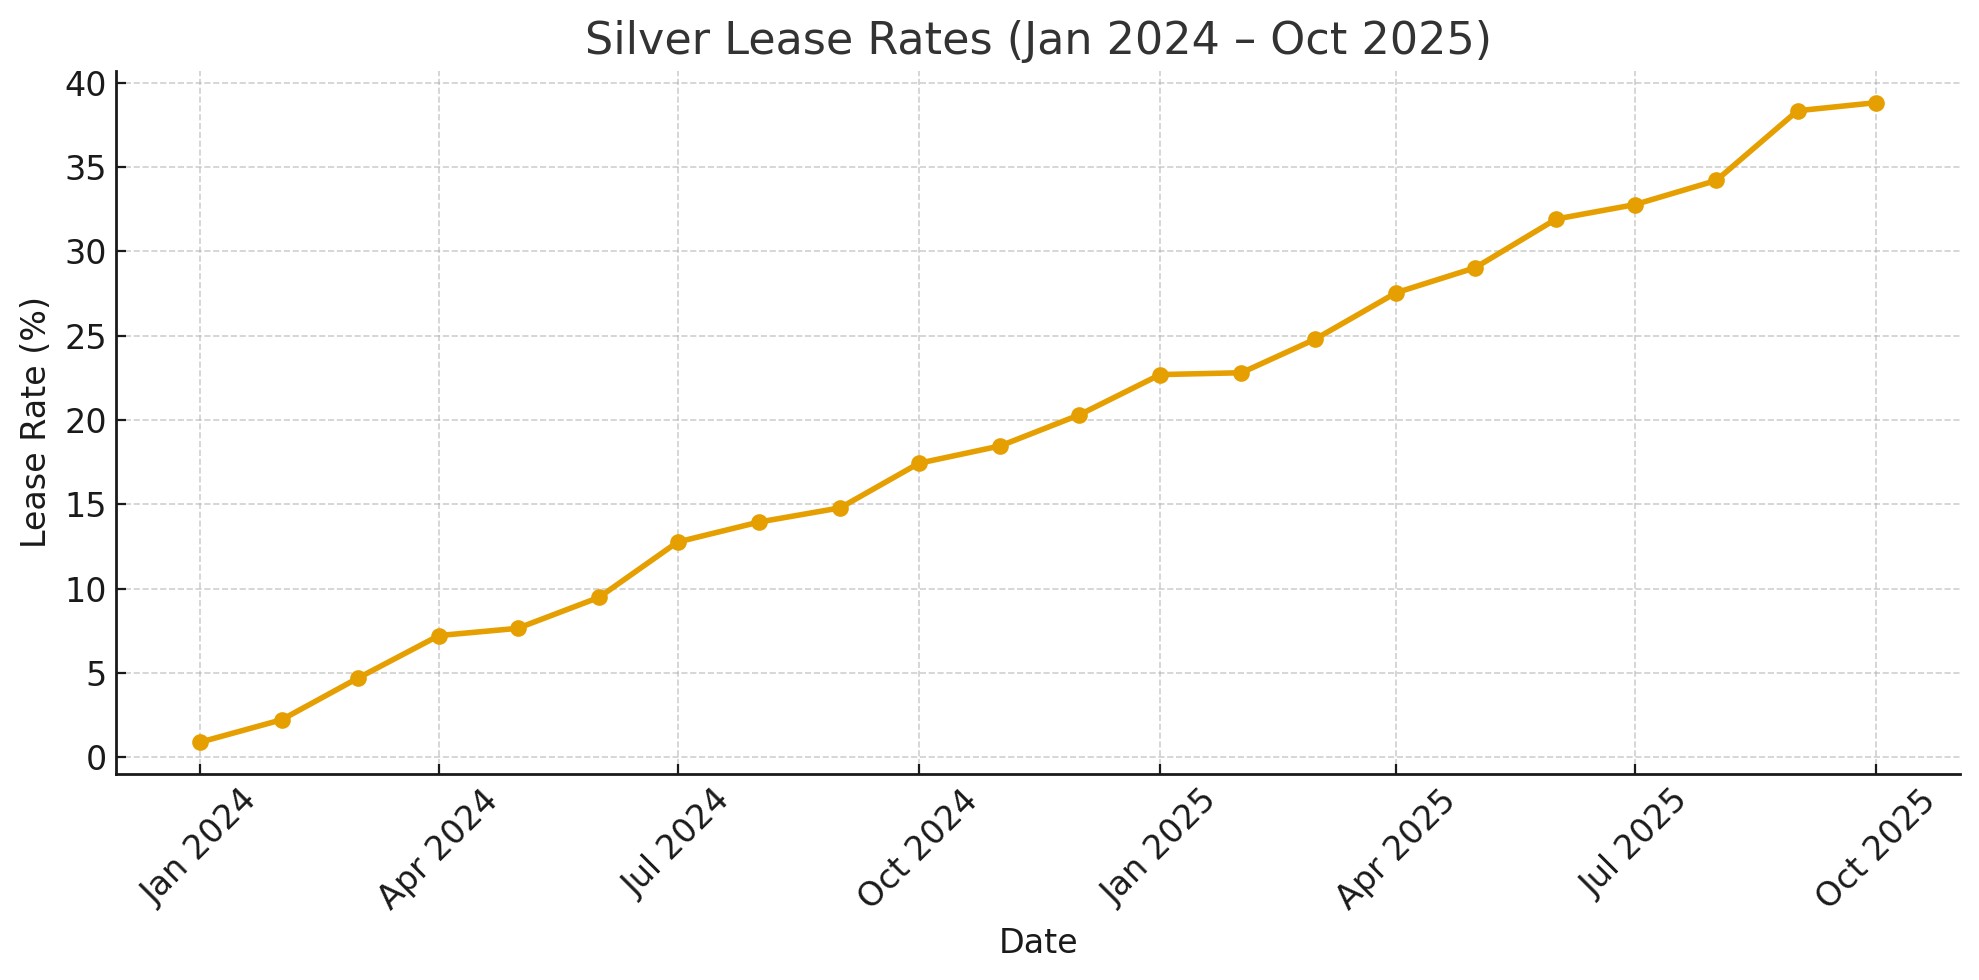
In the world of precious metals, lease rates represent the cost of borrowing physical silver – much like an interest rate, but with metal instead of currency. Under normal conditions, one-month silver lease rates hover around 0.3%–0.5%.
Yet in October 2025, those same rates spiked to nearly 40%, reflecting extreme scarcity of deliverable silver.
This is not a paper-driven price spike – it’s a sign of true physical tightness.
When traders are willing to pay such extreme premiums simply to access silver immediately, it suggests that inventories are being rapidly depleted.
London, one of the world’s key silver trading hubs, has been hit particularly hard.
According to recent data from the London Bullion Market Association (LBMA), total silver holdings have fallen nearly 40% since 2021, marking one of the steepest declines on record. This also demonstrates that this supply squeeze has been coiling for some time to create today’s explosive movement.
This drop has been exacerbated by:
This supply imbalance has created major problems for traders holding short positions in silver futures.
In simple terms, short sellers commit to delivering silver at a future date, expecting prices to fall so they can repurchase the metal more cheaply.
However, with the spot price surging above $50 (£41) and lease rates exceeding 35%, many have been unable to source physical silver to honour their contracts.
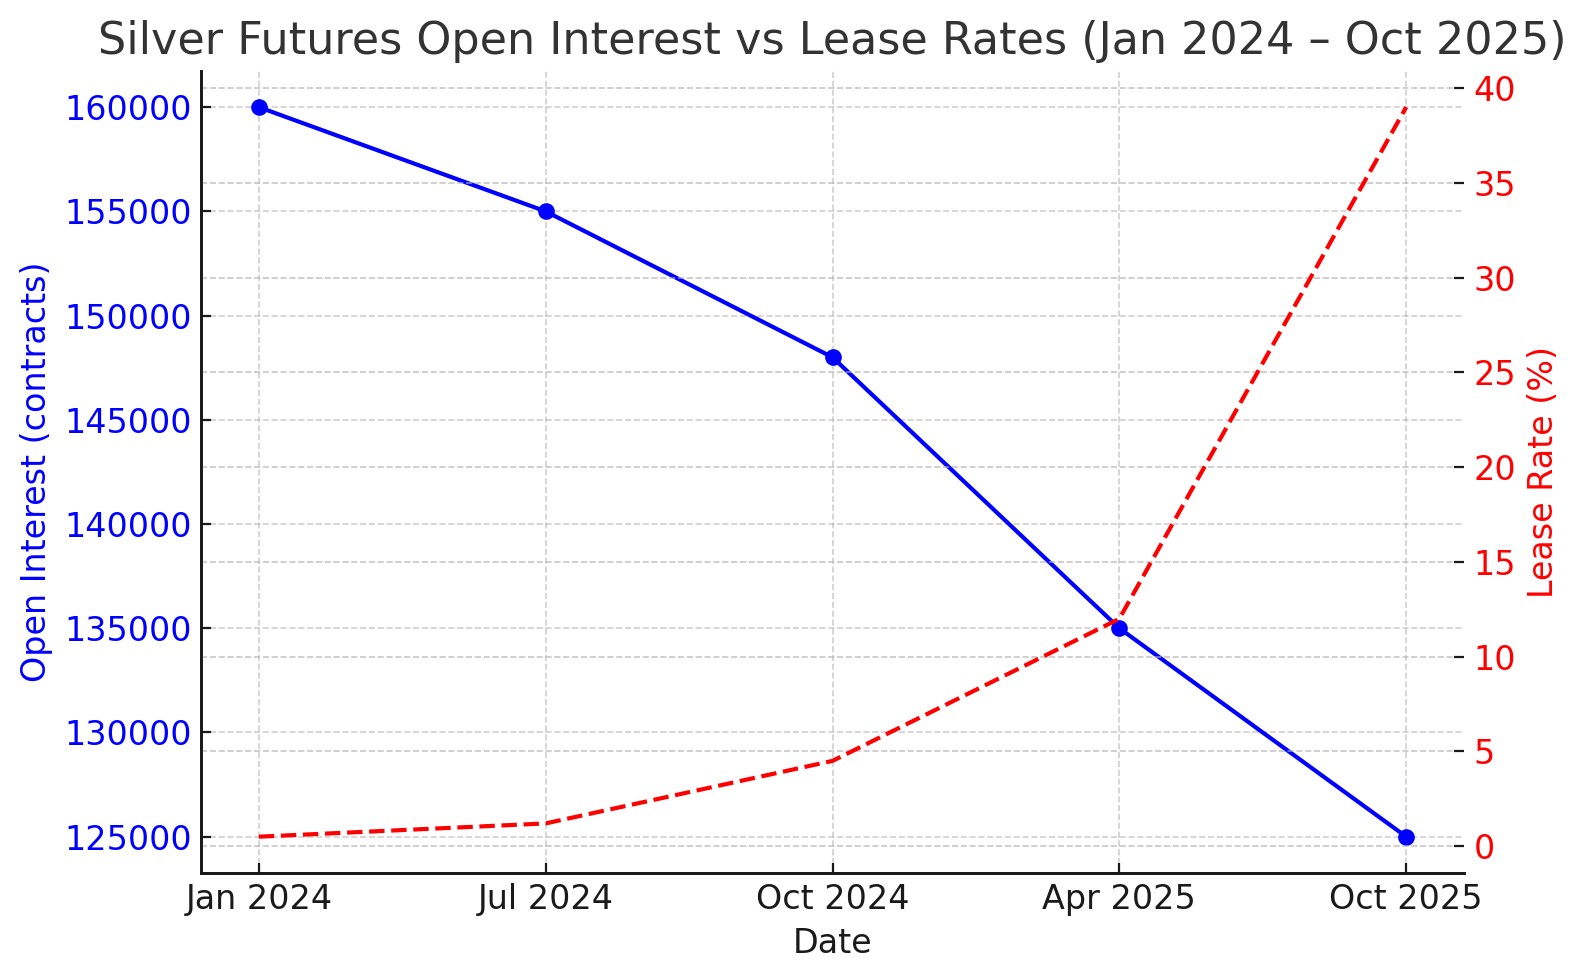
Data from the CME Group show that open interest in COMEX silver futures fell by more than 22% between August and October 2025, suggesting that short traders have been forced to unwind positions early.
Meanwhile, exchange inventories – the metal available for delivery – dropped from 290 million ounces at the start of 2024 to below 210 million ounces by October 2025, according to LBMA and COMEX warehouse reports.
The result is a “short squeeze” dynamic:
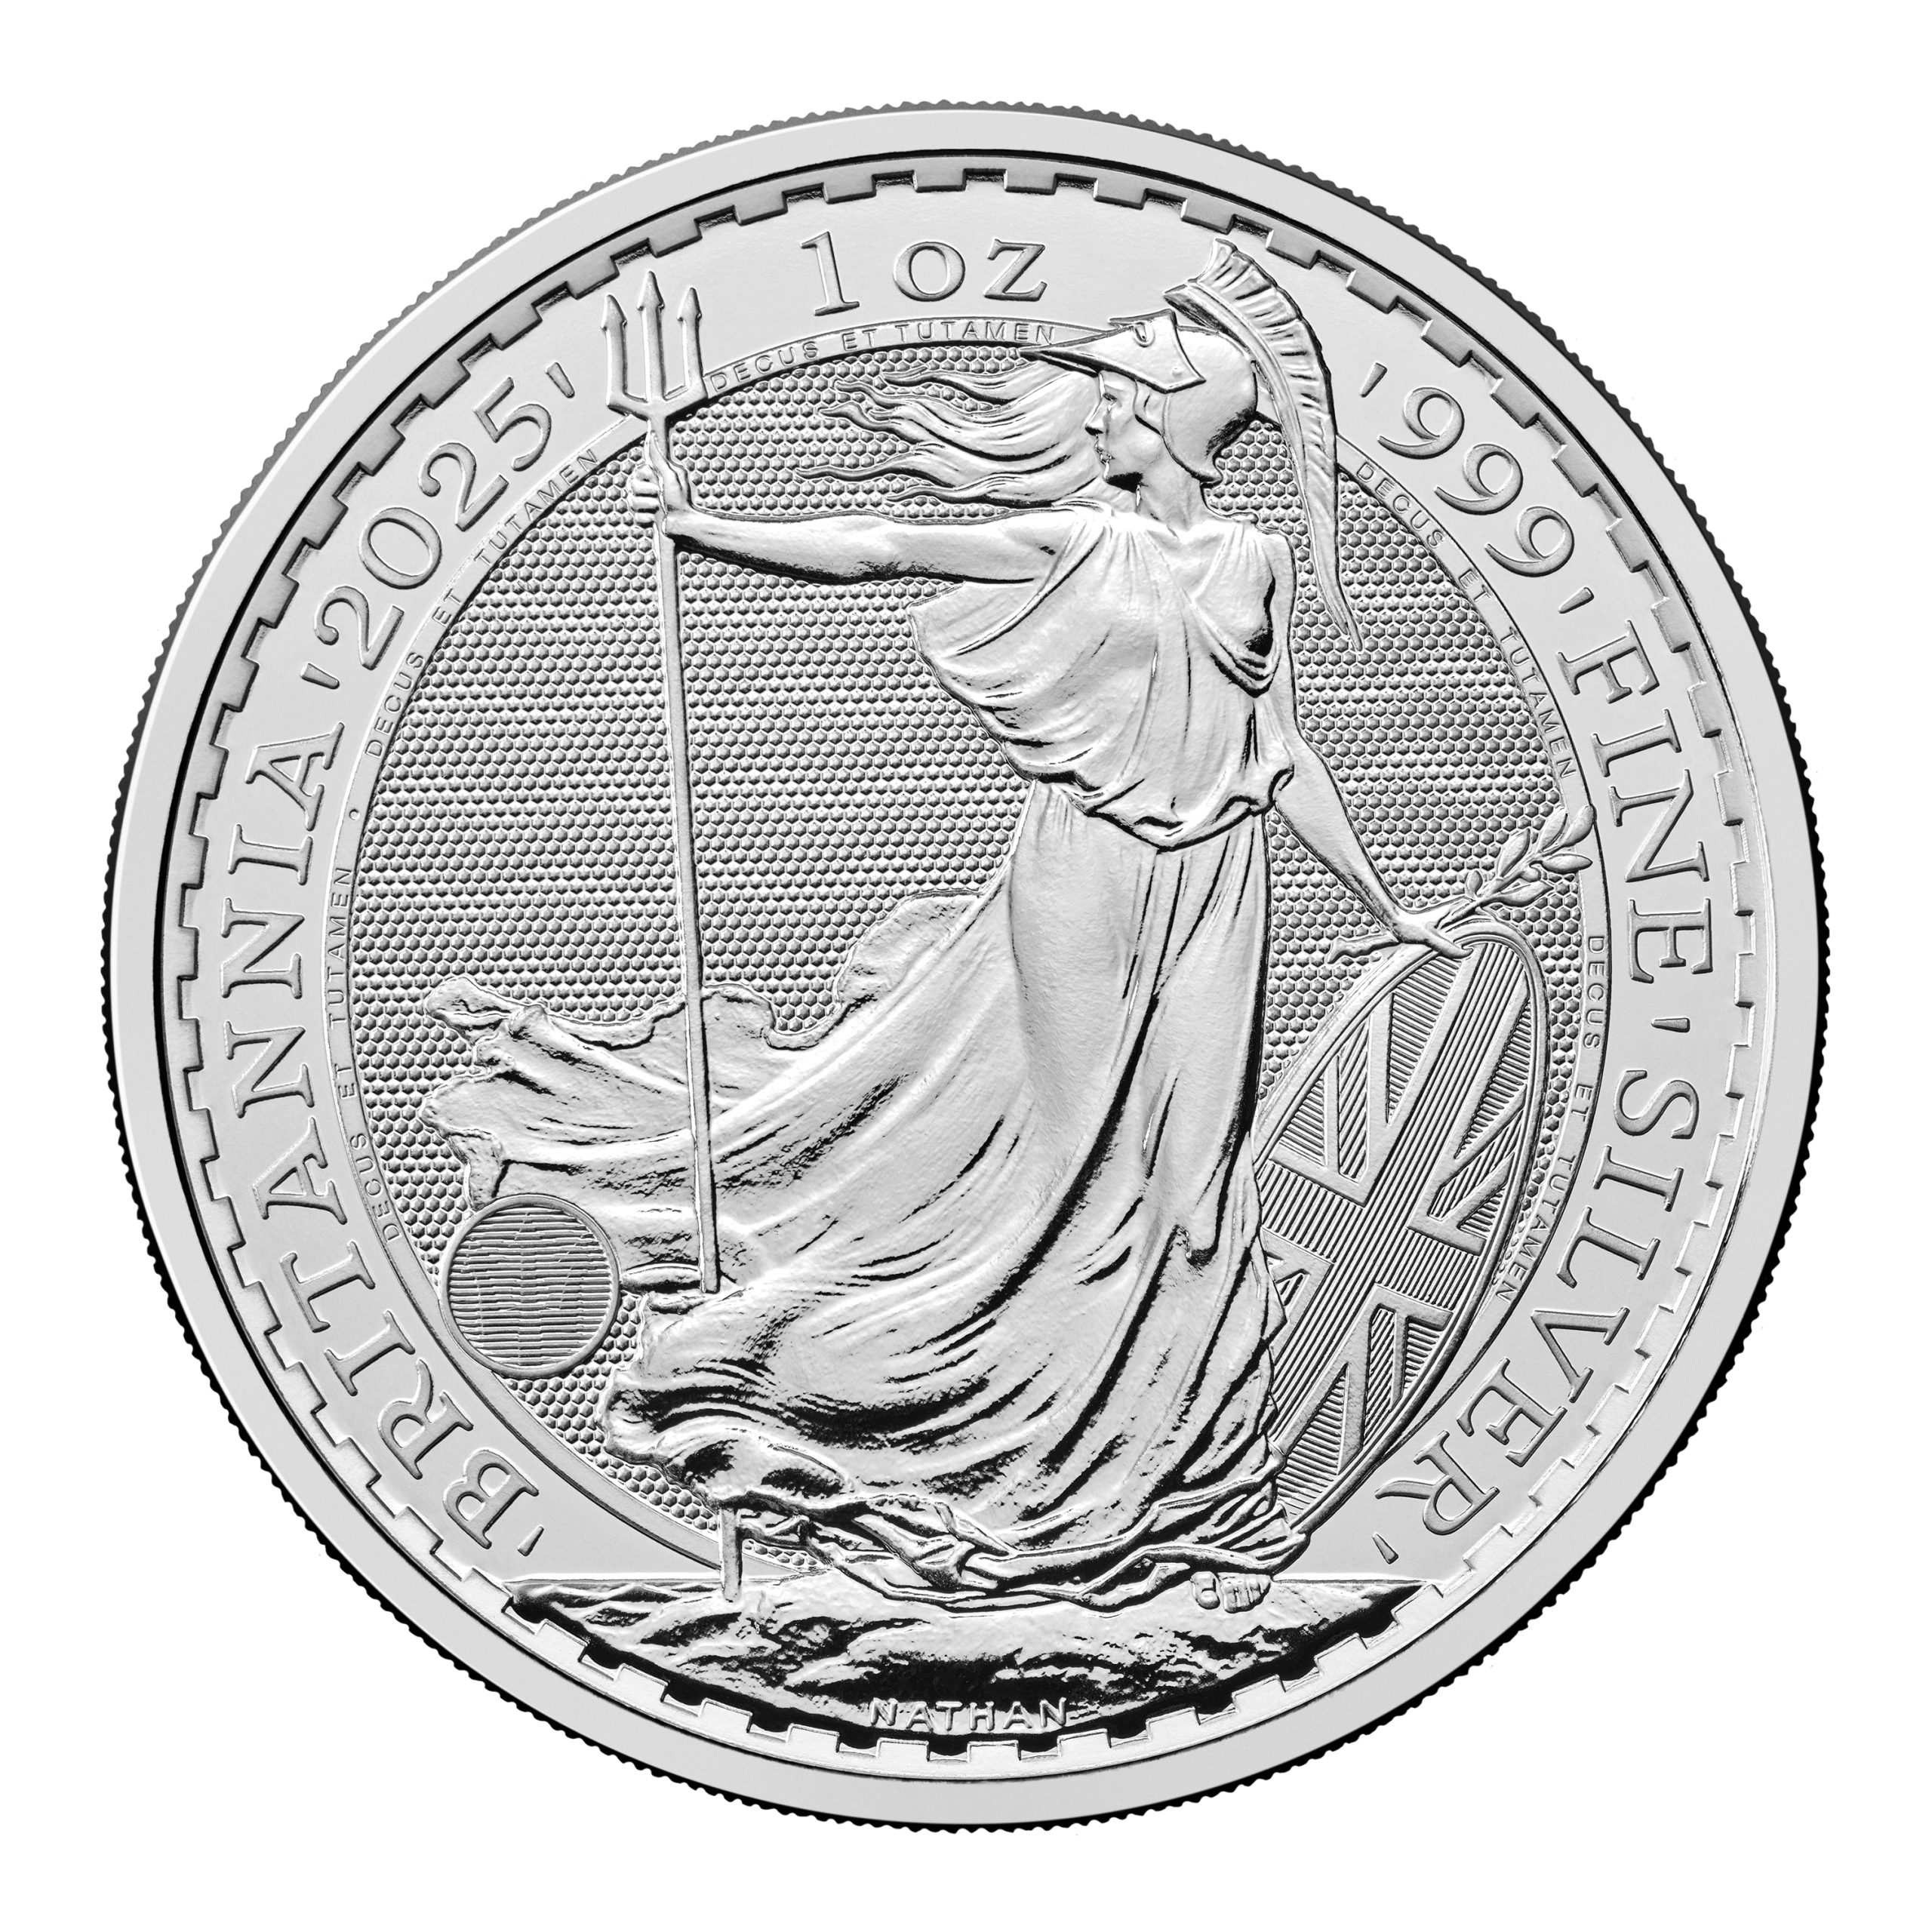
This squeeze has not only tightened futures markets but has also spilled into the physical bullion trade. Premiums on popular coins such as the 1 oz Silver Britannia and American Silver Eagle have widened to £9–£12 per ounce above spot, compared to just £3–£4 earlier in the year.
It’s a clear indication that this is not a speculative bubble but a genuine shortage of deliverable silver, affecting every layer of the market – from institutional traders to retail investors.
This table shows a clear pattern of stress: open interest and inventories are falling sharply while lease rates and spot premiums are soaring. These concurrent shifts are the hallmark of a true physical short squeeze, not a speculative one.
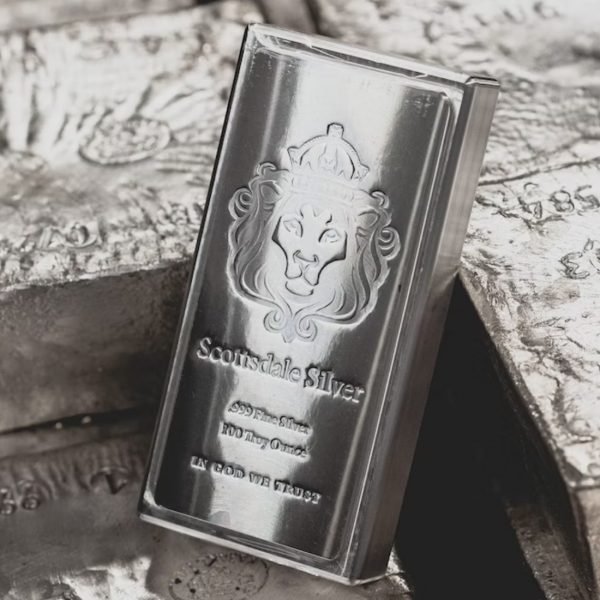
Most mints and refiners don’t hold vast stockpiles of silver. Instead, they lease the metal from bullion banks, refine or mint it, and then repay the borrowed silver once new supply arrives.
With lease rates now sky-high, the economics of this system are breaking down.
For some refiners, borrowing silver has become uneconomical or even unviable, forcing them to prioritise core products and delay less profitable lines.
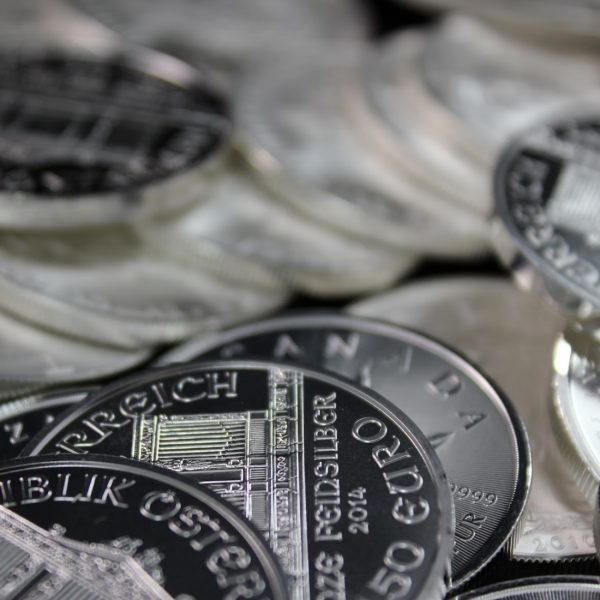
In Britain, several major bullion dealers have reported limited inventories or “out of stock” notices on popular coins such as the Silver Britannia. At Physical Gold we’ve experienced 2-3 week delays on obtaining stock from mints, then several days delay despatching orders due to sheer demand.
The Royal Mint and private refiners alike are facing higher input costs, and premiums on physical silver bars and coins have widened sharply as a result.
It’s easy to assume that surging prices will automatically lead to higher production, but the silver market doesn’t respond that quickly. Unlike gold, silver is rarely mined as a primary metal. Around 70% of global output comes as a by-product of base-metal mining, mainly copper, zinc, and lead. That means output depends on the economics of those other metals, not silver itself.
Even with prices above $50 (£41) per ounce, few miners can significantly increase production without expanding base-metal projects – which require multi-year investment cycles, environmental permits, and infrastructure.
For example:
Recycled silver, mostly recovered from electronic waste, jewellery, and old photographic materials – typically provides 15–20% of annual supply. However, recycling volumes have plateaued in recent years. Much of today’s industrial silver use is dissipative, meaning it’s spread across tiny electronic components that are uneconomic to recover.
For a deeper understanding of the silver supply dynamic
Exploration budgets for new silver projects remain well below pre-2012 levels, even as prices hit records. Many major mining firms have shifted focus towards lithium, nickel, and copper – metals tied to electrification. This diversion of capital leaves the silver sector under-funded.
The Silver Institute projects global mine production at around 830 million ounces in 2025, still below the 2016 peak of 900 million ounces. Meanwhile, industrial demand is expected to reach 810 million ounces this year – leaving virtually no margin for error.
Related reading:
The surge in silver demand is being driven not just by investors but also by industrial innovation due to silver’s unique properties.
Silver’s unique electrical conductivity makes it essential in solar panels, EV batteries, data-centre circuitry, and AI computing hardware.
As nations accelerate the energy transition, industrial usage continues to expand.
Solar panel manufacturers alone are projected to consume 25% of global silver output by 2030, according to industry forecasts.
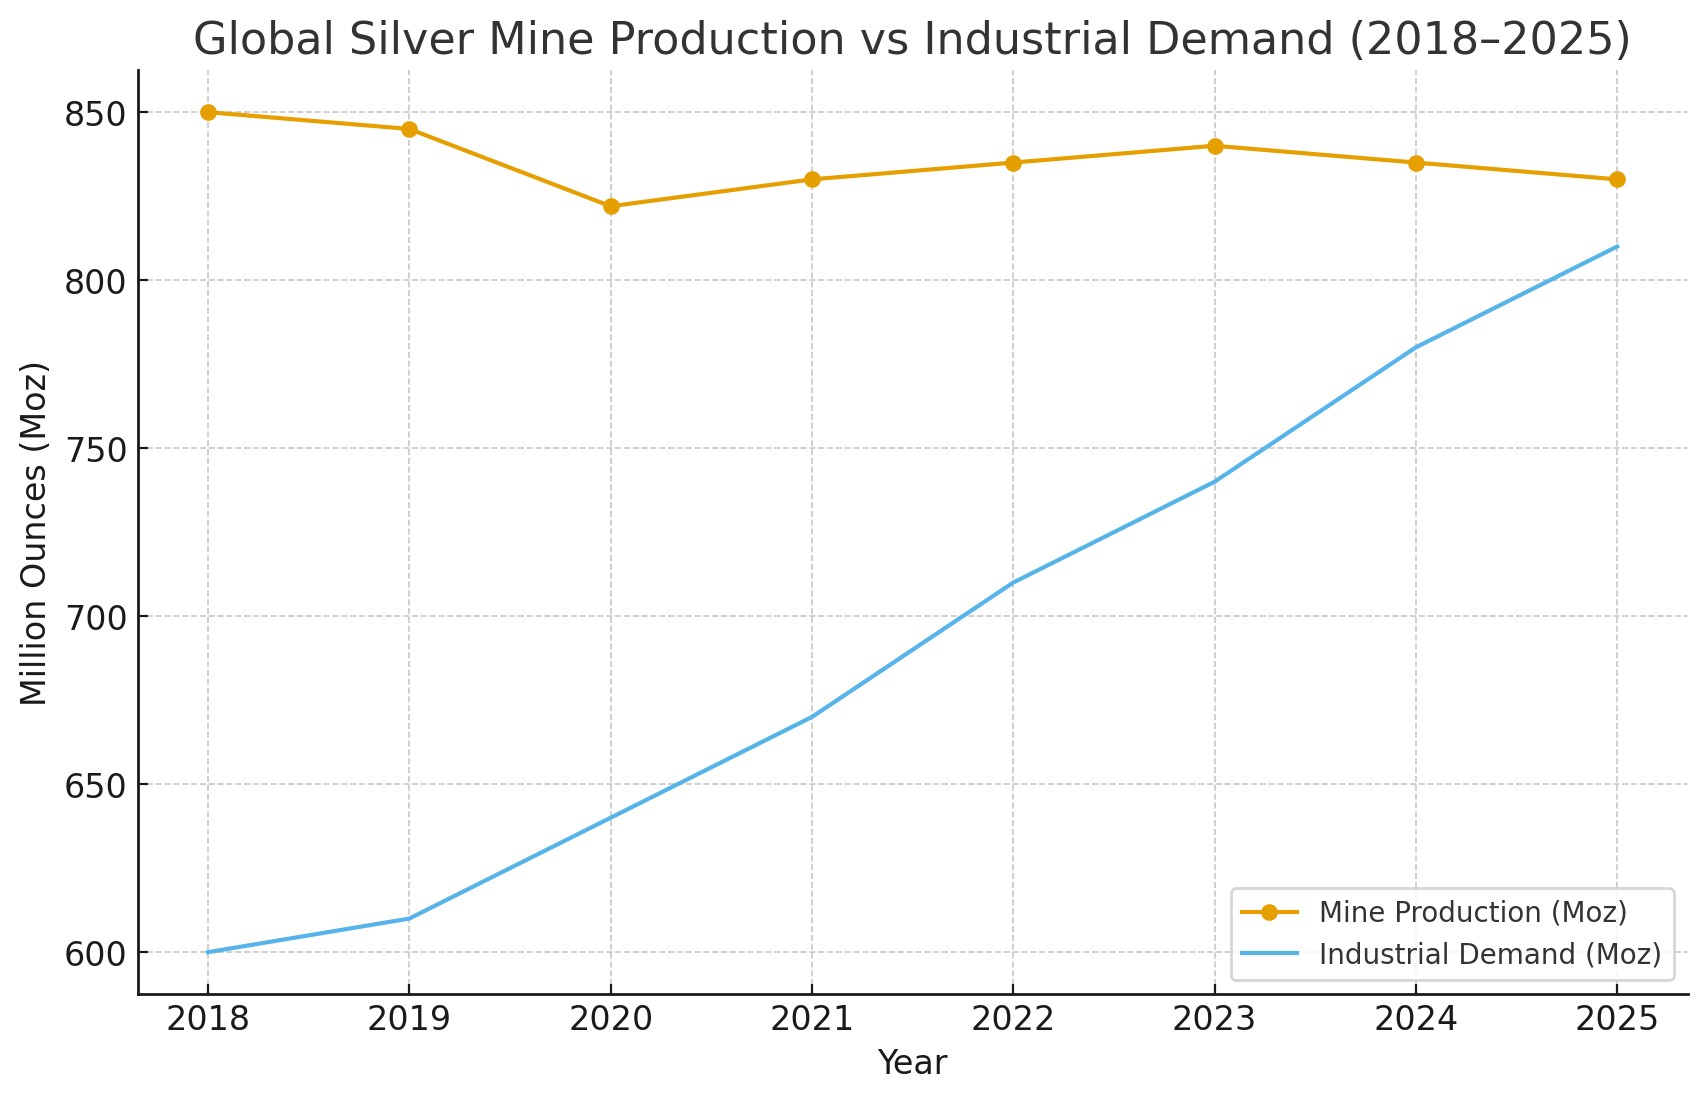
This chart illustrates the growing mismatch between industrial consumption and mining output - a key driver of the 2025 squeeze
As prices approach $50 (£41) per ounce, physical investors are facing a challenging environment:
Some investors have begun to take profits, selling into strength – but so far, every minor dip has been swiftly bought, suggesting that sentiment remains firmly bullish.
In the short term, the situation is likely to remain tense.
Even if prices stabilise, the structural supply deficit – alongside strong industrial demand – will keep the market tight.
Potential easing could come from:
However, these factors typically take years to materialise – not months.
The 2025 silver squeeze is more than market hype – it reflects a perfect storm of tightening supply, surging industrial demand, and stressed logistics.
Whether prices continue to climb or eventually cool, one thing is clear: silver’s role in modern technology and investment portfolios is stronger than ever.
For UK investors, keeping an eye on premiums and availability at trusted dealers is essential – as silver’s scarcity looks set to persist well into 2026.

Share this post on:
Latest Posts:
Live Gold Spot Price in Sterling. Gold is one of the densest of all metals. It is a good conductor of heat and electricity. It is also soft and the most malleable and ductile of the elements; an ounce (31.1 grams; gold is weighed in troy ounces) can be beaten out to 187 square feet (about 17 square metres) in extremely thin sheets called gold leaf.
Live Silver Spot Price in Sterling. Silver (Ag), chemical element, a white lustrous metal valued for its decorative beauty and electrical conductivity. Silver is located in Group 11 (Ib) and Period 5 of the periodic table, between copper (Period 4) and gold (Period 6), and its physical and chemical properties are intermediate between those two metals.